Linux memory monitoring (allocations Vs usage)

How to use some of Linux’s standard tools and how different types of memory usage shows up.

Examples of using malloc and writing to memory with three use-cases for a simple process

In each case we run the example with a 64MB allocation so that we can see the usage from standard linux tools.

We do something like this

gary@linux:~/git/unixfun$ ./malloc_and_write 65536
Allocating 65536 KB
Allocating 67108864 bytes
The address of your memory is 0x7fa2829ff010
Hit <return> to exit
Continue reading

Using iperf multi-stream may not work as expected

Running iperf with parallel threads

TL;DR – When running iperf with parallel threads/workers the -P option must be specified after the -c <target-IP> option. This is mentioned in the manpage but some options (-t for instance) work in any order, while others (specifically the -P for parallel threads) definitely does not, which is a bit confusing.

For example – these two invocations of iperf give very different results

  • iperf -P 5 -c 10.56.68.97 (The -P before -c) -Yields 20.4 Gbits/sec
  • iperf -c 10.56.68.97 -P 5 (The -P after the -c)- Yields 78.3 Gbits/sec
Continue reading

How to monitor SQLServer on Windows with Prometheus

TL;DR

  • Enable SQLServer agent in SSMS
  • Install the Prometheus Windows exporter from github the installer is in the Assets section near the bottom of the page
  • Install Prometheus scraper/database to your monitoring server/laptop via the appropriate installer
  • Point a browser to the prometheus server e.g. :9090
    • Add a new target, which will be the Windows exporter installed in step.
    • It will be something like <SQLSERVERIP>:9182/metrics
    • Ensure the Target shows “Green”
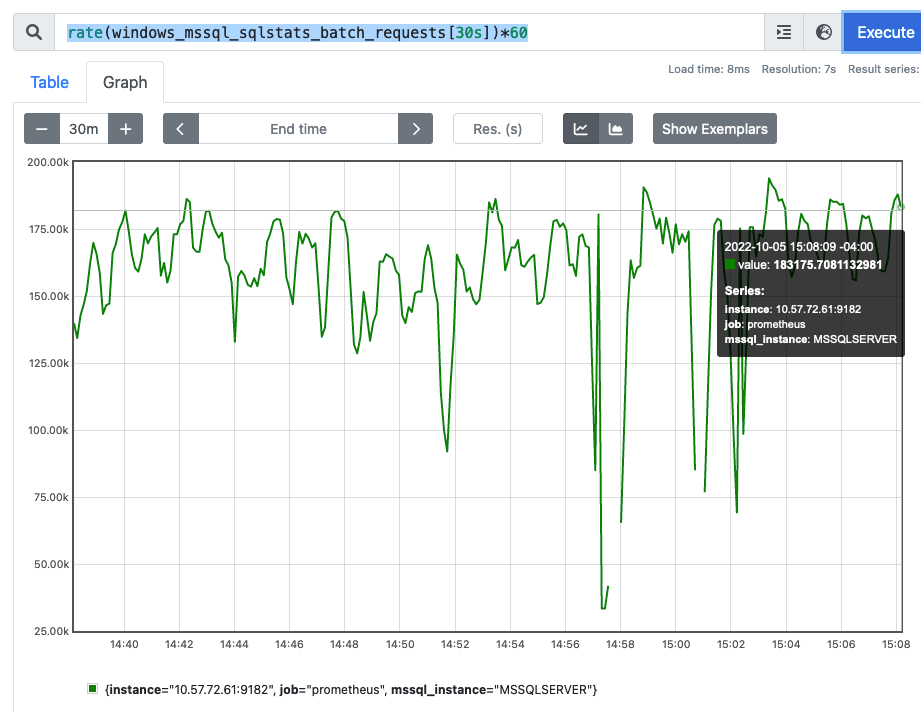
  • Check that we can scrape SQLserver tranactions. In the search/execute box enter something like this
    rate(windows_mssql_sqlstats_batch_requests[30s])*60
  • Put the SQLserver under load with something like HammerDB
  • Hit Execute on the Prometheus server search box and you should see a transaction rate similar to HammerDB
  • Install Grafana and Point it to the Prometheus server (See multiple examples of how to do this)
Continue reading

Generate load on Microsoft SQLserver Windows from HammerDB on Linux

HammerDB on Linux driving load to Windows SQL Server

Often it’s nice to be able to drive Windows applications and databases from Linux, especially if you are more comfortable in a Unix environment. This post will show you how to drive a Microsoft SQL Server database running on a Windows server from a remote Linux machine. In this example I am using Ubuntu 22.04, SQLserver 2019, Windows 11 and HammerDB 4.4

Continue reading

Using cloud-init with AHV command line

TL;DR

  • Using cloud-init with AHV is conceptually identical to using KVM/QEMU- we need to use a few different tools with AHV
  • You will need a Linux image that is configured to use cloud-init. A good source is cloud-images.ubuntu.com
  • We will create a cloud-init textual file and create a mountable version using the cloud-localds tool on a Linux host
  • We will attach the cloud-init enabled ubuntu image and our cloud-init customization file to the VM at boot time
  • At boottime ubuntu will access the cloud-init data mounted as a CDROM and do the customization for us
Continue reading

Why does my SSD not issue 1MB IO’s?

First things First

https://commons.wikimedia.org/wiki/File:CDC9762-smd-drive.jpg
CDC 9762 SMD disk drive from 1974

Why do we tend to use 1MB IO sizes for throughput benchmarking?

To achieve the maximum throughput on a storage device, we will usually use a large IO size to maximize the amount of data is transferred per IO request. The idea is to make the ratio of data-transfers to IO requests as large as possible to reduce the CPU overhead of the actual IO request so we can get as close to the device bandwidth as possible. To take advantage of and pre-fetching, and to reduce the need for head movement in rotational devices, a sequential pattern is used.

For historical reasons, many storage testers will use a 1MB IO size for sequential testing. A typical fio command line might look like something this.

fio --name=read --bs=1m --direct=1 --filename=/dev/sda
Continue reading

Duplicate IP issues with Linux and virtual machine cloning.

TL;DR – Some modern Linux distributions use a newer method of identification which, when combined with DHCP can result in duplicate IP addresses when cloning VMs, even when the VMs have unique MAC addresses.

To resolve, do the following ( remove file, run the systemd-machine-id-setup command, reboot):

# rm /etc/machine-id
# systemd-machine-id-setup
# reboot

When hypervisor management tools make clones of virtual machines, the tools usually make sure to create a unique MAC address for every clone. Combined with DHCP, this is normally enough to boot the clones and have them receive a unique IP. Recently, when I cloned several Bitnami guest VMs which are based on Debian, I started to get duplicate IP addresses on the clones. The issue can be resolved manually by following the above procedure.

To create a VM template to clone from which will generate a new machine-id for very clone, simply create an empty /etc/machine-id file (do not rm the file, otherwise the machine-id will not be generated)

# echo "" |  tee /etc/machine-id 

The machine-id man page is a well written explanation of the implementation and motivation.

Performance gains for postgres on Linux with hugepages

For this experiment I am using Postgres v11 on Linux 3.10 kernel. The goal was to see what gains can be made from using hugepages. I use the “built in” benchmark pgbench to run a simple set of queries.

Since I am interested in only the gains from hugepages I chose to use the “-S” parameter to pgbench which means perform only the “select” statements. Obviously this masks any costs that might be seen when dirtying hugepages – but it kept the experiment from having to be concerned with writing to the filesystem.

Experiment

The workstation has 32GB of memory
Postgres is given 16GB of memory using the parameter

shared_buffers = 16384MB


pgbench creates a ~7.4gb database using a scale-factor of 500

pgbench -i -s 500

Run the experiment like this

$ pgbench -c 10 -S -T 600 -P 1 p gbench

Result

Default : No hugepages :
tps = 62190.452850 (excluding connections establishing)

2MB Hugepages
tps = 66864.410968 (excluding connections establishing)
+7.5% over default

1GB Hugepages
tps = 69702.358303 (excluding connections establishing)
+12% over default

Enabling hugepages

Getting the default hugepages is as easy as entering a value into /etc/sysctl.conf. To allow for 16GB of hugepages I used the value of 8400, followed by “sysctl -p”

[root@arches gary]# grep huge /etc/sysctl.conf 
vm.nr_hugepages = 8400
[root@arches gary]# sysctl -p

To get 1GB hugepages, the kernel has to have it configured during boot e.g.

[root@arches boot]# grep CMDLINE /etc/default/grub
GRUB_CMDLINE_LINUX="rd.lvm.lv=centos/swap vconsole.font=latarcyrheb-sun16 rd.lvm.lv=centos/root crashkernel=auto vconsole.keymap=us rhgb quiet rdblacklist=nouveau default_hugepagesz=1G hugepagesz=1G

Then reboot the kernel

I used these excellent resources
How to modify the kernel command line
How to enable hugepages
and this great video on Linux virtual memory