Effects of CPU topology on sqlserver guests with AHV.

VM CPU Topology

The topology (layout) that AHV presents virtual Sockets/CPU to the guest operating system will usually be different than the physical topology. This is expected because we typically present a subset of all cores to the guest VMs.

Usually it is the total number of vCPU given to the VM that matters, not the specific topology, but in the case of SQLserver running an analytical workload (a TPC-H like workload from HammerDB) the topology passed to the VM does make a difference. Between 10% and 20% when measured by the total runtime.

[I think that the reason we see a difference here is that (a) the analytical workloads use hardly any storage bandwidth (I sized the database to fit in memory) and (b) there is probably a lot of cross-talk between the cores/memory as the DB engine issues parallel queries.]

At any rate we see that passing 20 cores as “20 sockets of 1 core” beats the performance of “1 socket with 20 cores” by a wide margin. The physical topology is two sockets of 20 cores on each socket. Thankfully the better performing option is the default.

CPU Topology may make a difference for SQL server running analytical workloads.
Continue reading

How to monitor SQLServer on Windows with Prometheus

TL;DR

  • Enable SQLServer agent in SSMS
  • Install the Prometheus Windows exporter from github the installer is in the Assets section near the bottom of the page
  • Install Prometheus scraper/database to your monitoring server/laptop via the appropriate installer
  • Point a browser to the prometheus server e.g. :9090
    • Add a new target, which will be the Windows exporter installed in step.
    • It will be something like <SQLSERVERIP>:9182/metrics
    • Ensure the Target shows “Green”
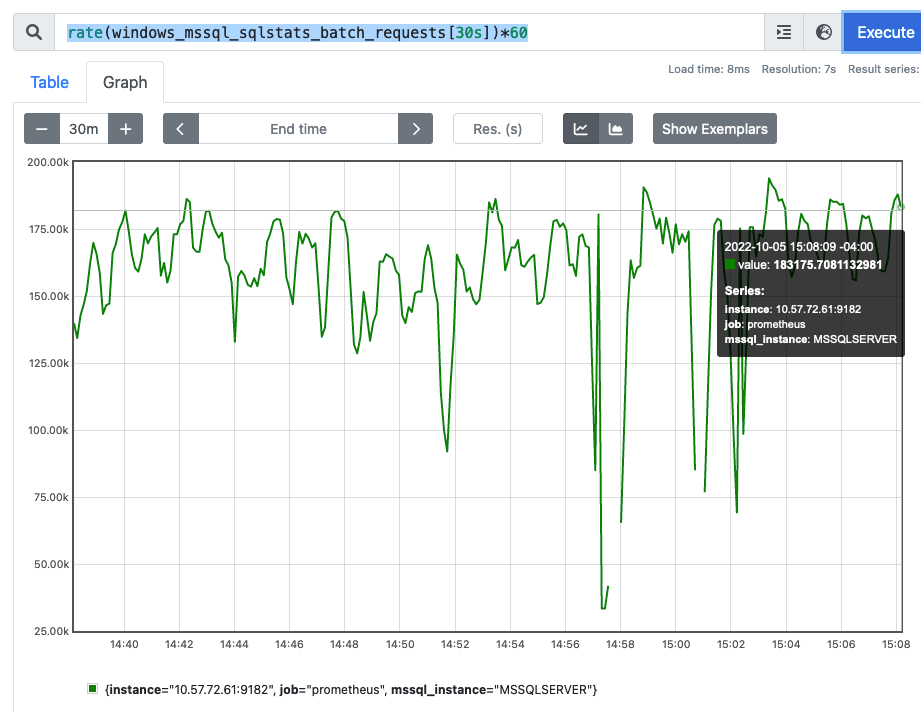
  • Check that we can scrape SQLserver tranactions. In the search/execute box enter something like this
    rate(windows_mssql_sqlstats_batch_requests[30s])*60
  • Put the SQLserver under load with something like HammerDB
  • Hit Execute on the Prometheus server search box and you should see a transaction rate similar to HammerDB
  • Install Grafana and Point it to the Prometheus server (See multiple examples of how to do this)
Continue reading

Generate load on Microsoft SQLserver Windows from HammerDB on Linux

HammerDB on Linux driving load to Windows SQL Server

Often it’s nice to be able to drive Windows applications and databases from Linux, especially if you are more comfortable in a Unix environment. This post will show you how to drive a Microsoft SQL Server database running on a Windows server from a remote Linux machine. In this example I am using Ubuntu 22.04, SQLserver 2019, Windows 11 and HammerDB 4.4

Continue reading

SQL Server uses only one NUMA Node with HammerDB

Some versions of HammerDB (e.g. 3.2) may induce imbalanced NUMA utilization with SQL Server.

This can easily be observed with Resource monitor. When NUMA imbalance occurs one of the NUMA nodes will show much larger utilization than the other. E.g.

Imbalanced NUMA usage by SQL Server.

The cause and fix is well documented on this blog. In short HammerDB issues a short lived connection, for every persistent connection. This causes the SQL Server Round-robin allocation to send all the persistent worker threads to a single NUMA Node! To resolve this issue, simply comment out line #212 in the driver script.

Comment out this line to work-around the HammerDB NUMA imbalance problem.

If successful you will immediately see that the NUMA nodes are more balanced. Whether this results in more/better performance will depend on exactly where the bottleneck is.

Balanced NUMA usage by SQL Server

How to run vertica vioperf tool

The vertica vioperf tool is used to determine whether the storage you are planning on using is fast enough to feed the vertica database. When I initially ran the tool, the IO performance reported by the tool and confirmed by iostat was much lower than I expected for the storage device (a 6Gbit SATA device capable of around 500MB/s read and write).

The vioperf tool runs on a linux host or VM and can be pointed at any filesystem just like fio or vdbench

Simple execution of vioperf writing to the location /vertica

vioperf --thread-count=8 --duration=120s  /vertica

Working Set Size

Unlike traditional IO generators vioperf does not allow you to specify the working-set size. The amount of data written is simply 1MB* Achieved IO rate * runtime. So, fast storage with long run-times will need a lot of capacity otherwise the tool simply fills the partition and crashes!

Measurement and goodness

The primary metric is MB/s Per-Core. The idea is that you give 1 Thread per core in the system, though there is nothing stopping you from using whatever –thread-count value you like.

Although the measure is throughput, the primary metric of (Throughput/Core) does not improve just by giving lots of concurrency. Concurrency is generated purely by the number of threads and since the measure of goodness is Throughput/Core (or per thread) it’s not possible to simply create throughput from concurrency alone.

Throughput compared to FIo

Compared to fio the reported throughput is lower for the same device and same degree of concurrency. Vertica continually writes, and extends the files so there is some filesystem work going on whereas fio is typically overwriting an existing file. If you observe iostat during the vioperf run you will see that the IO size to disk is different than what an fio run will generate. Again this is due to the fact that vioperf is continually extending the file(s) being written and so it needs to update filesystem metadata quite frequently. These small metadata updates skew the average IO size lower.

fio with 1MB IO and 1 thread

Notice the avgrq size is 1024 blocks (512KB) which is the maximum transfer size that this drive supports.

 fio --filename=/samsung/vertica/file --size=5g --bs=1m --ioengine=libaio --iodepth=1 --rw=write --direct=1 --name=samsung --create_on_open=0


avg-cpu:  %user   %nice %system %iowait  %steal   %idle
           4.16    0.00    3.40    0.00    0.00   92.43

Device:         rrqm/s   wrqm/s     r/s     w/s    rkB/s    wkB/s avgrq-sz avgqu-sz   await r_await w_await  svctm  %util
sdb               0.00     0.00    0.00  920.00     0.00 471040.00  1024.00     1.40    1.53    0.00    1.53   1.02  93.80

Vertica IOstat 1 thread

Firstly we see that iostat reports much lower disk throughput than what we achieved with fio for the same offered workload (1MB IO size with 1 outstanding IO (1 thread).

Also notice that that although vioperf issues 1MB IO sizes (which we can see from strace) iostat does not report the same 1024 block transfers as we see when we run iostat during an fio run (as above).

In the vioperf case the small metadata writes that are needed to continually extend the file cause a average IO size than than overwriting an existing file. Perhaps that is the cause of the lower performance?

./vioperf --duration=300s --thread-count=1 /samsung/vertica

avg-cpu:  %user   %nice %system %iowait  %steal   %idle
           8.77    0.13    2.38    5.26    0.00   83.46

Device:         rrqm/s   wrqm/s     r/s     w/s    rkB/s    wkB/s avgrq-sz avgqu-sz   await r_await w_await  svctm  %util
sdb               0.00     0.00    0.00  627.00     0.00 223232.00   712.06     1.02    1.63    0.00    1.63   0.69  43.20
strace -f ./vioperf --duration=300s --thread-count=1 --disable-crc /samsung/vertica
...
[pid  1350] write(6, "v\230\242Q\357\250|\212\256+}\224\270\256\273\\\366k\210\320\\\330z[\26[\6&\351W%D"..., 1048576) = 1048576
[pid  1350] write(6, "B\2\224\36\250\"\346\241\0\241\361\220\242,\207\231.\244\330\3453\206'\320$Y7\327|5\204b"..., 1048576) = 1048576
[pid  1350] write(6, "\346r\341{u\37N\254.\325M'\255?\302Q?T_X\230Q\301\311\5\236\242\33\1)4'"..., 1048576) = 1048576
[pid  1350] write(6, "\5\314\335\264\364L\254x\27\346\3251\236\312\2075d\16\300\245>\256mU\343\346\373\17'\232\250n"..., 1048576) = 1048576
[pid  1350] write(6, "\272NKs\360\243\332@/\333\276\2648\255\v\243\332\235\275&\261\37\371\302<\275\266\331\357\203|\6"..., 1048576) = 1048576
[pid  1350] write(6, "v\230\242Q\357\250|\212\256+}\224\270\256\273\\\366k\210\320\\\330z[\26[\6&\351W%D"..., 1048576) = 1048576
...

However, look closely and you will notice that the %user is higher than fio for a lower IO rate AND the disk is not 100% busy. That seems odd.

./vioperf --duration=300s --thread-count=1 /samsung/vertica

avg-cpu:  %user   %nice %system %iowait  %steal   %idle
           8.77    0.13    2.38    5.26    0.00   83.46

Device:         rrqm/s   wrqm/s     r/s     w/s    rkB/s    wkB/s avgrq-sz avgqu-sz   await r_await w_await  svctm  %util
sdb               0.00     0.00    0.00  627.00     0.00 223232.00   712.06     1.02    1.63    0.00    1.63   0.69  43.20

vioperf with –disable-crc

Finally we disable the crc checking (which vioperf does by default) to get a higher throughput more similar to what we see with fio.

It turns out that the lower performance was not due to the smaller IO sizes (and additonal filesystem work) but was caused the CRC checking that the tool does to simulate the vertica application.

 ./vioperf --duration=300s --thread-count=1 --disable-crc /samsung/vertica

avg-cpu:  %user   %nice %system %iowait  %steal   %idle
           8.77    0.13    2.38    5.26    0.00   83.46

Device:         rrqm/s   wrqm/s     r/s     w/s    rkB/s    wkB/s avgrq-sz avgqu-sz   await r_await w_await  svctm  %util
sdb               0.00     0.00    0.00  627.00     0.00 223232.00   712.06     1.02    1.63    0.00    1.63   0.69  43.20
View from Nutanix storage during Postgres DB benchmark

Following on from the previous [1] [2] experiments with Postgres & pgbench. A quick look at how the workload is seen from the Nutanix CVM.

The Linux VM running postgres has two virtual disks:

  • One is taking transaction log writes.
  • The other is doing reads and writes from the main datafiles.

Since the database size is small (50% the size of the Linux RAM) – the data is mostly cached inside the guest, and so most reads do not hit storage. As a result we only see writes going to the DB files.

Additionally, we see that database datafile writes the arrive in a bursty fashion, and that these write bursts are more intense (~10x) than the log file writes.

Charts from Prometheus/Grafana showing IO rates seen from the perspective of the Linux guest VM

Despite the database flushes ocurring in bursts with a decent amount of concurrency the Nutanix CVM provides an average of 1.5ms write response time.

From the Nutanix CVM port 2009 handler, we can access the individual vdisk statistics. In this particular case vDisk 45269 is the data file disk, and 40043 is the database transaction log disk.

Datafile writes completed in 1.5millisecond average – despite deep queues during burst

The vdisk categorizer correctly identifies the database datafile write pattern as highly random.

Writes to the datbase datafiles are almost entirely random

As a result, the writes are passed into the replicated oplog

The burst of writes hits the oplog as expected

Meanwhile the log writes are categorized as mostly sequential, which is expected for a database log file workload.

Meanwhile, log file writes are mostly categorized as sequential.

Even though the log writes are sequential, they are low-concurrency and small size (looks like mostly 16K-32K). This write pattern is also a good candidate for oplog.

These low-concurrency log writes also hit oplog

Benchmarking with Postgres PT2

In this example we run pgbench with a scale factor of 1000 which equates to a database size of around 15GB. The linux VM has 32G RAM, so we don’t expect to see many reads.

Using prometheus with the Linux node exporter we can see the disk IO pattern from pgbench. As expected the write pattern to the log disk (sda) is quite constant, while the write pattern to the database files (sdb) is bursty.

pgbench with DB size 50% of Linux buffer cache.

I had to tune the parameter checkpoint_completion_target from 0.5 to 0.9 otherwise the SCSI stack became overwhelmed during checkpoints, and caused log-writes to stall.

default pgbench – notice the sharp drop in log-writes before tuning.


Benchmarking with Postgres PT1

Image By Daniel Lundin

In this example, we use Postgres and the pgbench workload generator to drive some load in a virtual machine.  Assume a Linux virtual machine that has Postgres installed. Specifically using a Bitnami virtual appliance.

  • Once the VM has been started, connect to the console
  • Allow access to postgres port 5432 – which is the postgres DB port or allow ssh
$ sudo ufw allow 5432
  • Note the postgres user password (cat ./bitnami_credentials)
  •  Login to psql from the console or ssh
psql -U postgres
  • Optionally change password (the password prompted is the one from bitnami_credentials for the postgres database user).
psql -U postgres
postgres=# alter user postgres with password 'NEW_PASSWORD';
postgresl=# \q
  • Create a DB to run the pgbench workload.  In this case I name the db pgbench-sf10 for “Scale Factor 10”.  Scale Factors are how the size of the database is determined.
$ sudo -u postgres createdb pgbench-sf10
  • Initialise the DB with data ready to run the benchmark.  The “createdb” step just creates an empty schema.
    • -i means “initialize”
    • -s means “scale factor” e.g. 10
    • pgbench-sf10 is the database schema to use.  We use the one just created pgbench-sf10
$ sudo -u postgres pgbench -i -s 10 pgbench-sf10
  • Noe run a workload against the DB schema called pgbench-sf10
$ sudo -u postgres pgbench pgbench-sf10

The workload pattern, and load on the system will vary greatly depending on the scale factor.  

Scale-Factor        Working Set Size


1                                   23M
10                                157M
100                             1.7GB
1000                          15GB
2500                          37GB
5000                         74GB
10000                       147GB


Performance gains for postgres on Linux with hugepages

For this experiment I am using Postgres v11 on Linux 3.10 kernel. The goal was to see what gains can be made from using hugepages. I use the “built in” benchmark pgbench to run a simple set of queries.

Since I am interested in only the gains from hugepages I chose to use the “-S” parameter to pgbench which means perform only the “select” statements. Obviously this masks any costs that might be seen when dirtying hugepages – but it kept the experiment from having to be concerned with writing to the filesystem.

Experiment

The workstation has 32GB of memory
Postgres is given 16GB of memory using the parameter

shared_buffers = 16384MB


pgbench creates a ~7.4gb database using a scale-factor of 500

pgbench -i -s 500

Run the experiment like this

$ pgbench -c 10 -S -T 600 -P 1 p gbench

Result

Default : No hugepages :
tps = 62190.452850 (excluding connections establishing)

2MB Hugepages
tps = 66864.410968 (excluding connections establishing)
+7.5% over default

1GB Hugepages
tps = 69702.358303 (excluding connections establishing)
+12% over default

Enabling hugepages

Getting the default hugepages is as easy as entering a value into /etc/sysctl.conf. To allow for 16GB of hugepages I used the value of 8400, followed by “sysctl -p”

[root@arches gary]# grep huge /etc/sysctl.conf 
vm.nr_hugepages = 8400
[root@arches gary]# sysctl -p

To get 1GB hugepages, the kernel has to have it configured during boot e.g.

[root@arches boot]# grep CMDLINE /etc/default/grub
GRUB_CMDLINE_LINUX="rd.lvm.lv=centos/swap vconsole.font=latarcyrheb-sun16 rd.lvm.lv=centos/root crashkernel=auto vconsole.keymap=us rhgb quiet rdblacklist=nouveau default_hugepagesz=1G hugepagesz=1G

Then reboot the kernel

I used these excellent resources
How to modify the kernel command line
How to enable hugepages
and this great video on Linux virtual memory


SuperScalin’: How I learned to stop worrying and love SQL Server on Nutanix.

TL;DR  It’s pretty easy to get 1M SQL TPM running a TPC-C like workload on a single Nutanix node.  Use 1 vDisk for Log files, and 6 vDisks for data files.  SQL Server  needs enough CPU and RAM to drive it.  I used 16 vCPU’s  and 64G of RAM.

Running database servers on Nutanix is an increasing trend and DBA’s are naturally skeptical about moving their DB’s to new platforms.  I recently had the chance to run some DB benchmarks on a couple of nodes in our lab.  My goal was to achieve 1M SQL transactions per node, and have that be linearly scalable across multiple nodes.

Screen Shot 2014-11-26 at 5.50.58 PM

It turned out to be ridiculously easy to generate decent numbers using SQL Server.  As a Unix and Oracle old-timer it was a shock to me, just how simple it is to throw up a SQL server instance.  In this experiment, I am using Windows Server 2012 and SQL-Server 2012.

For the test DB I provision 1 Disk for the SQL log files, and 6 disks for the data files.  Temp and the other system DB files are left unchanged.  Nothing is tuned or tweaked on the Nutanix side, everything is setup as per standard best practices – no “benchmark specials”.

SQL Server TPCC Scaling

Load is being generated by HammerDB configured to run the OLTP database workload.  I get a little over 1Million SQL transactions per minute (TPM) on a single Nutanix node.  The scaling is more-or-less linear, yielding 4.2 Million TPM  with 4 Nutanix nodes, which fit in a single 2U chassis . Each node is running both the DB itself, and the shared storage using NDFS.  I stopped at 6 nodes, because that’s all I had access to at the time.

The thing that blew me away in this was just how simple it had been.  Prior to using SQL server, I had been trying to set up Oracle to do the same workload.  It was a huge effort that took me back to the 1990’s, configuring kernel parameters by hand – just to stand up the DB.  I’ll come back to Oracle at a later date.

My SQL Server is configured with 16 vCPU’s and 64GB of RAM, so that the SQL server VM itself has as many resources as possible, so as not to be the bottleneck.

I use the following flags on SQL server.  In SQL terminology these are known as traceflags which are set in the SQL console (I used “DBCC trace status” to display the following.  These are fairly standard and are mentioned in our best practice guide.

Screen Shot 2014-11-30 at 8.38.45 PM

One thing I did change from the norm was to set the target recovery time to 240 seconds, rather than let SQL server determine the recovery time dynamically.  I found that in the benchmarking scenario, SQL server would not do any background flushing at all,  and then suddenly would checkpoint a huge amount of data which caused the TPM to fluctuate wildly.  With the recovery time hard coded to 240 seconds, the background page flusher keeps up with the incoming workload, and does not need to issue huge checkpoints.  My guess is that in real (non benchmark conditions) SQL server waits for the incoming work to drop-off and issues the checkpoint at that time.  Since my benchmark never backs off, SQL server eventually has to issue the checkpoint.

Screen Shot 2014-11-26 at 5.39.07 PM