How can database density be measured?
- How does database performance behave as more DBs are consolidated?
- What impact does running the CVM have on available host resources?
tl;dr
- The cluster was able to achieve ~90% of the theoretical maximum.
- CVM overhead was 5% for this workload.
Experiment setup
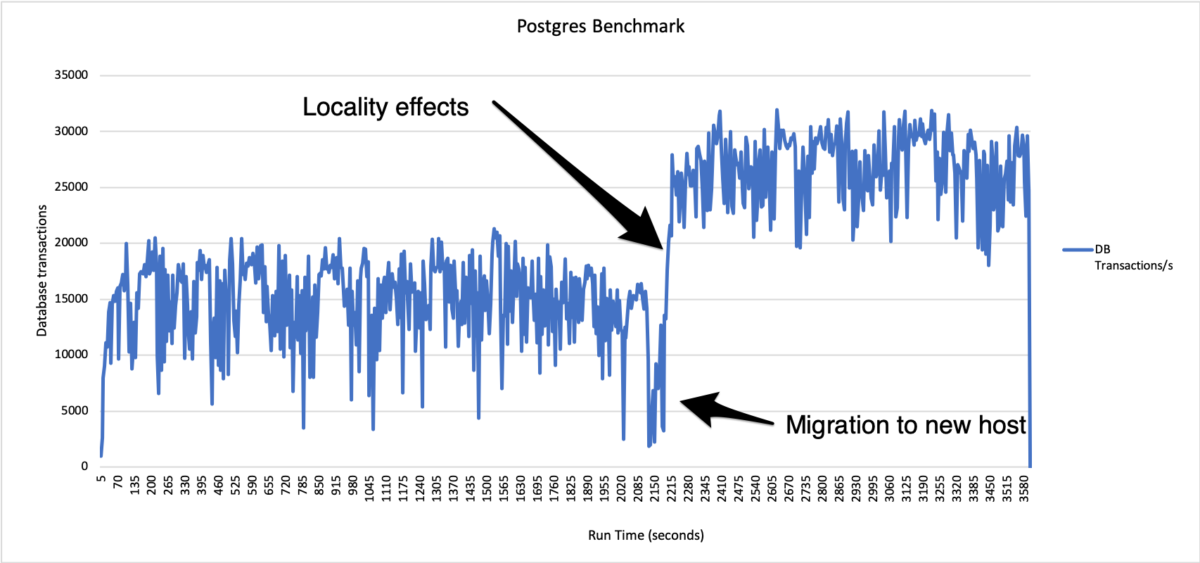
The goal was to establish how database performance is affected as additional database workloads are added into the cluster. As a secondary metric, measure the overhead from running the virtual storage controller on the same host as the database servers themselves. We use the Postgres database with pgbench workload and measure the total transactions per second.
Cluster configuration
- 4 Node Nutanix cluster, with 2x Xeon CPU’s per host with 20 cores per socket.
Database configuration
Each database is identically configured with
- Postgres 9.3
- Ubuntu Linux
- 4 vCPU
- 8GB of memory
- pgbench benchmark, running the “simple” query set.
The database is sized so that it fits entirely in memory. This is a test of CPU/Memory not IO.
Experiment steps.
The experiment starts with a single Database on a single host. We add more databases into the cluster until we reach 40 databases in total. At 40 databases with 4 vCPU each and a CPU bound workload we use all 160 CPU cores on the cluster.
The database is configured to fit into the host DRAM memory, and the benchmark runs as fast as it can – the benchmark is CPU bound.
Results
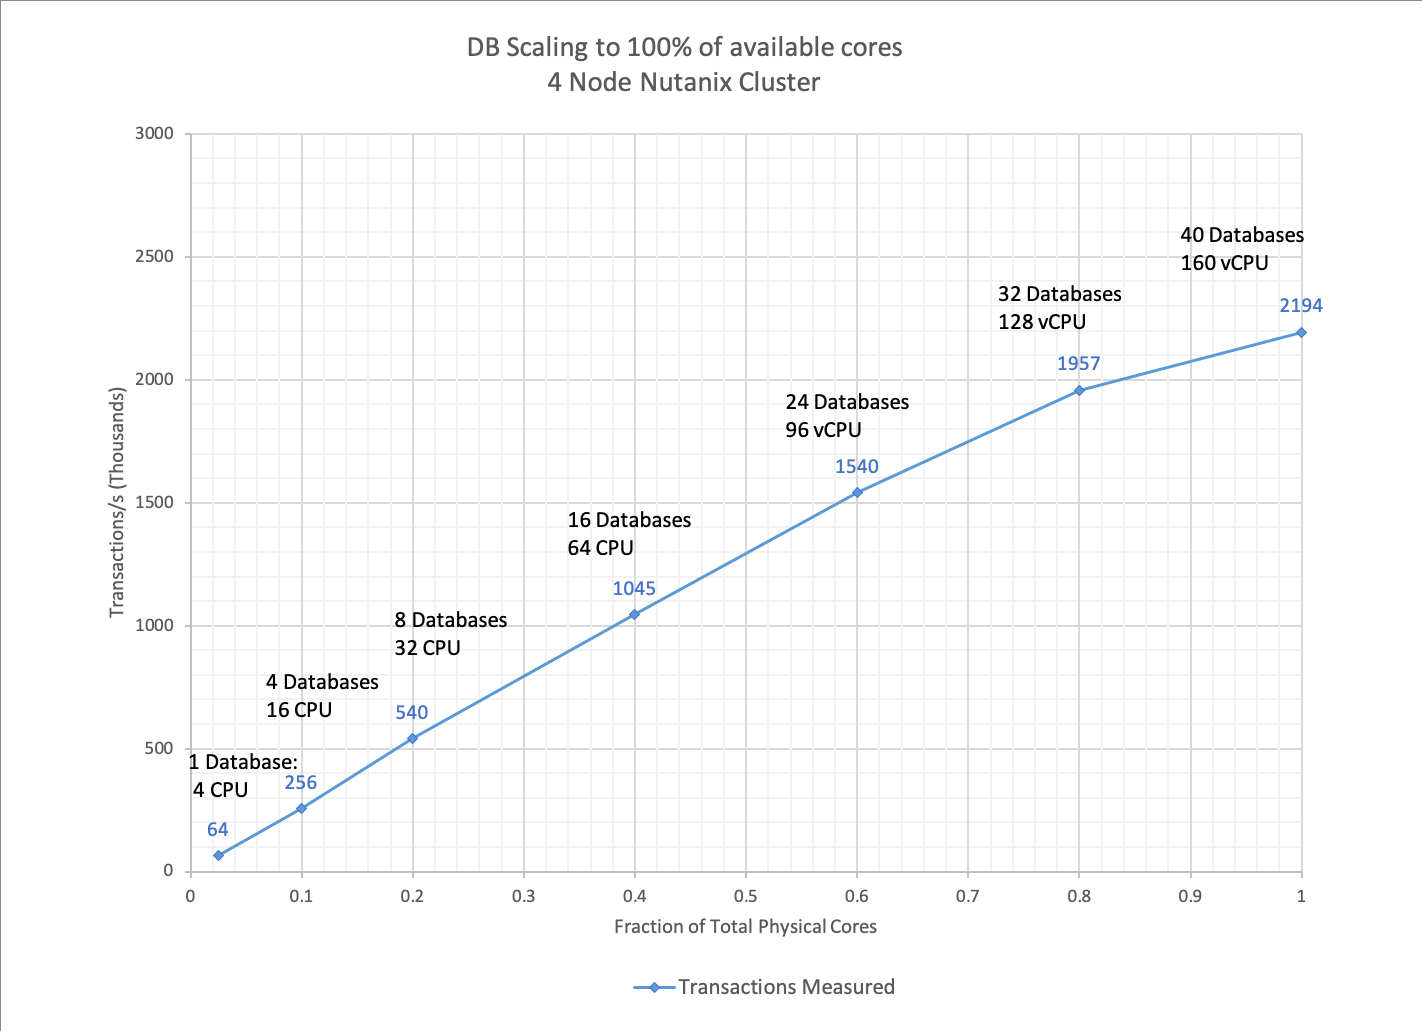
Below are the measured results from running 1-40 databases on the 4 node cluster.
Performance scales almost linearly from 4 to 160 CPU with no obvious bottlenecks before all of the CPU cores are saturated in the host at 40 databases.

Perfect Scaling Vs Achieved scaling.
So what does the above chart tell us about scaling on the cluster? Are the results, good bad or indifferent? To understand how well the system was able to scale – i.e. continue to give the same performance for each new database added to the system – we compare the measured result to what we would expect in a “perfectly scaling platform”.
The column headed “perfect scaling” takes the measured value for a single database and multiplies that value by the number of databases running. By doing so we can see that the measured value and “perfect” value diverge as the workload begins to saturate the system. This is expected and is mostly due to the effects explained in the Universal Scalability Law (USL)
At maximum load (all 40 cores busy) we see that the measured value is 2194 compared to a “perfect” score of 2560. So we can say that our system scaled to >85% of the absolute theoretical maximum. Which is pretty good.
| DB Count | Total Cores | Fraction of total cores | Measured Transactions/s (K) | Perfect Scaling Transactions/s (K) |
| 1DB | 4 | 0.025 | 64 | 64 |
| 4DB | 16 | 0.1 | 256 | 256 |
| 8DB | 32 | 0.2 | 540 | 512 |
| 16DB | 64 | 0.4 | 1045 | 1024 |
| 24DB | 96 | 0.6 | 1540 | 1536 |
| 32DB | 128 | 0.8 | 1957 | 2048 |
| 40DB | 160 | 1 | 2194 | 2560 |

Storage CVM overhead measurement
As we scale the workload, we start to see CPU pressure impact the ability to perfectly scale. Some of this is well understood from the USL in our case – even though the DB workload itself completely independent – the workloads themselves are running on the shared CPU and under a shared hypervisor/scheduler.
We do still need to account for the CVM – which continues to run and provide services.
To try and calculate the overhead I chose to take the values at 80% of saturation. Anything lower than that, and the measured value is equal to the perfect value – showing that there is no resource contention. Past the 80% mark we are clearly in to diminishing returns due to the shared resources having to manage contention and coherency.
At 80% saturation the difference between “perfect” and “measured is about 5% measured (1957) / perfect (2048) = 0.95
So with 160 cores – we expect the CVM to be consuming 5% of 160 cores which is 8 cores across the cluster, or 2 cores per host.
However, the CVM in our setup is configured to use 16 vCPU.

The view from Prism confirms that although the CVM is configured with 16 vCPU – it is only using (on average) 12% of that allocation, which is around 2vCPU/cores
Conclusion
- Scaling is linear (perfect) up to 80% of total CPU capacity, which is expected mostly due to effects explained by the USL
- Actual CVM utilization is around 2 vCPU – in this example which is mostly a CPU bound workload
- The AHV Hypervisor is doing a nice job of prioritizing the database workloads over the CVM