Running the ML-Perf Storage benchmark on Nutanix files.

Some technical notes on our submission to the benchmark committee.

Background

For the past few months engineers from Nutanix have been participating in the MLPerftm Storage benchmark which is designed to measure the storage performance required for ML training workloads.  

We are pleased with how well our general-purpose file-server has delivered against the demands of this high throughput workload.  

Benchmark throughput and dataset
  • 125,000 files
  • 16.7 TB of data around 30% of the usable capacity (no “short stroking”)
  • Filesize 57-213MB per file
  • NFS v4 over Ethernet
  • 5GB/s delivered per compute node from single NFSv4 mountpoint
  • 25GB/s delivered across 5 compute nodes from single NFSv4 mountpoint

The dataset was 125,000 files consuming 16.7 TB, the file sizes ranged from 57 MB to 213 MB.  There is no temporal or spatial hotspot (meaning that the entire dataset is read) so there is no opportunity to cache the data in DRAM – the data is being accessed from NVMe flash media. For our benchmark submission we used standard NFSv4, standard Ethernet using the same Nutanix file-serving software that already powers everything from VDI users home-directories, medical images and more. No infiniband or special purpose parallel filesystems were harmed in this benchmark submission.

Benchmark Metric

The benchmark metric is the number of accelerators that the storage can keep busy.  In the first ML-Perf benchmark report we showed that we were able to supply enough storage bandwidth to drive 65 datacenter class ML processors (called “accelerators” in MLPerftm language) with a modest 5-node Nutanix cluster.  We believe that 65 accelerators maps to about 8x NVIDIA DGX-1 boxes. The delivered throughput was 5 GBytes per second over a single NFS mountpoint to a single client, or 25GB/s to 5 clients using the same single mountpoint. Enforcing that the results are delivered over a single NFS mountpoint helps to avoid simplistic hard-partitioning of the benchmark data.

Benchmark Setup

How is it possible to provide such high throughput over a large dataset using standard HCI nodes and standard NFS file services?  The short answer is by distributing both data and load equally across the entire cluster.  Nutanix Files implements a cluster of virtual file-servers (FSVMS) to act as a distributed NAS storage head.  We place these FSVMs on our existing VM storage which acts as a distributed virtual disk-shelf providing storage to the FSVMs.

The result is a high performance filer where storage compute load and data is spread across physical nodes and the disks within the nodes – thus avoiding hotspots.  

  • Each CVM uses all the local disks in the host for data, metadata and write log
  • Each FSVM uses all CVMs to load balance its back-end
  • Each NFS mount is balanced across all FSVMs using NFS V4 referrals (no client configuration required)
  • On the linux client we use the mount option nconnect=16 to generate multiple TCP streams per mountpoint

A Single File-Server VM (virtual storage controller) spreads its data disks (virtual disk shelf) across all nodes in the cluster

We repeat for each  File-Server VM in the cluster

This cluster of file-server VMs act as a single virtual storage controller.  In the case of the benchmark the work is performed over a single mount point.  Beneath this mountpoint the workload is spread across all of the FSVM’s using NFSv4 referrals.  No client-side configuration is required.

To improve network throughput, we use the Linux mount option nconnect=16 which gives 16 TCP/IP streams per mountpoint.

Our NFS solution is based on top of the Nutanix storage layer that we have been fine-tuning for over 10 years to provide high performance storage to VMs. The secret sauce of our performance can be summarized as “distributed everything”.

  • All nodes in the cluster contribute to storage performance
  • All nodes contribute to metadata performance – there is no idea of a “metadata server” subset of nodes.  All nodes contribute to both data and metadata performance
  • All physical disks in the system contribute to capacity and performance.  
  •  Data placement and optimization decisions are made in real time based on the incoming IO stream – data can be placed anywhere in the cluster at any time since all operations are distributed.

Taken together, all of this means we can put data in the right place at the right time in realtime.  

We take the same philosophy and apply it to the filer server layer. Our File Server is implemented as a set of file-server VMs (FSVMs) that operate together to provide a single namespace. The number of FSVMs depends on the number of nodes in the Nutanix cluster.  

To avoid hotspots each FSVM creates its “back-end” using disks across multiple nodes.  It sounds complex, but is all handled behind the scenes using NFS v4 referrals (RFC 7530)

The ML-Perf Storage benchmark is strictly focused on storage performance and we decided to pursue the unet3D workload which is an image based ML workload since it has the highest storage performance requirements.  Real-world applications for unet3D could be any type image recognition from surveillance to retail checkouts.

ML Inferencing on hyper-converged infrastructure  is already popular, because of the robust nature of the platform which is critical at the near-edge.  What is less usual is performing training on HCI due to the high throughput requirements.  Until now training has been thought of as requiring specialist storage appliances, however our experience with the benchmark has shown that our general purpose hyper-converged  file-server can provide substantial throughput performance.

Viewing Nutanix cluster metrics in prometheus/grafana

Using Nutanix API with prometheus push-gateway.

Many customers would like to view their cluster metrics alongside existing performance data using Prometheus/Grafana

Currently Nutanix does not provide a native exporter for Prometheus to use as a datasource. However we can use the prometheus push-gateway and a simple script which pulls from the native APIs to get data into prometheus. From there we can use Grafana or anything that can connect to Prometheus.

The goal is to be able to view cluster metrics alongside other Grafana dashboards. For example show the current Read/Write IOPS that the cluster is delivering on a per container basis. I’m hard-coding IPs and username/passwords in the script which obviously is not production grade, so don’t do that.

Continue reading

Effects of CPU topology on sqlserver guests with AHV.

VM CPU Topology

The topology (layout) that AHV presents virtual Sockets/CPU to the guest operating system will usually be different than the physical topology. This is expected because we typically present a subset of all cores to the guest VMs.

Usually it is the total number of vCPU given to the VM that matters, not the specific topology, but in the case of SQLserver running an analytical workload (a TPC-H like workload from HammerDB) the topology passed to the VM does make a difference. Between 10% and 20% when measured by the total runtime.

[I think that the reason we see a difference here is that (a) the analytical workloads use hardly any storage bandwidth (I sized the database to fit in memory) and (b) there is probably a lot of cross-talk between the cores/memory as the DB engine issues parallel queries.]

At any rate we see that passing 20 cores as “20 sockets of 1 core” beats the performance of “1 socket with 20 cores” by a wide margin. The physical topology is two sockets of 20 cores on each socket. Thankfully the better performing option is the default.

CPU Topology may make a difference for SQL server running analytical workloads.
Continue reading

fio versions < 3.3 may show inflated random write performance

TL;DR

If your storage system implements inline compression, performance results with small IO size random writes with time_based and runtime may be inflated with fio versions < 3.3 due to fio generating unexpectedly compressible data when using fio’s default data pattern. Although unintuitive, performance can often be increased by enabling compression especially if the bottleneck is on the storage media, replication or a combination of both.

fio 2.8.1 vs fio 3.33 data patterns

Therefore if you are comparing performance results generated using fio version < 3.3 and fio >=3.3 the random write performance on the same storage platform my appear reduced with more recent fio versions.

fio-3.3 was released in December 2017 but older fio versions are still in use particularly on distributions with long term (LTS) support. For instance Ubuntu 16, which is supported until 2026 ships with fio-2.2.10

Continue reading

Specifying Drive letters with fio for Windows.

fio on Windows

Download pre-compiled fio binary for Windows

Example fio windows file, single drive

This will create a 1GB file called fiofile on the F:\ Drive in Windows then read the file.  Notice that the specification is “Driveletter” “Backslash” “Colon” “Filename”

In fio terms we are “escaping” the : which fio traditionally uses as a file separator.

[global]
bs=1024k
size=1G
time_based
runtime=30
rw=read
direct=1
iodepth=8

[job1]
filename=F\:fiofile 
Continue reading

How to monitor SQLServer on Windows with Prometheus

TL;DR

  • Enable SQLServer agent in SSMS
  • Install the Prometheus Windows exporter from github the installer is in the Assets section near the bottom of the page
  • Install Prometheus scraper/database to your monitoring server/laptop via the appropriate installer
  • Point a browser to the prometheus server e.g. :9090
    • Add a new target, which will be the Windows exporter installed in step.
    • It will be something like <SQLSERVERIP>:9182/metrics
    • Ensure the Target shows “Green”
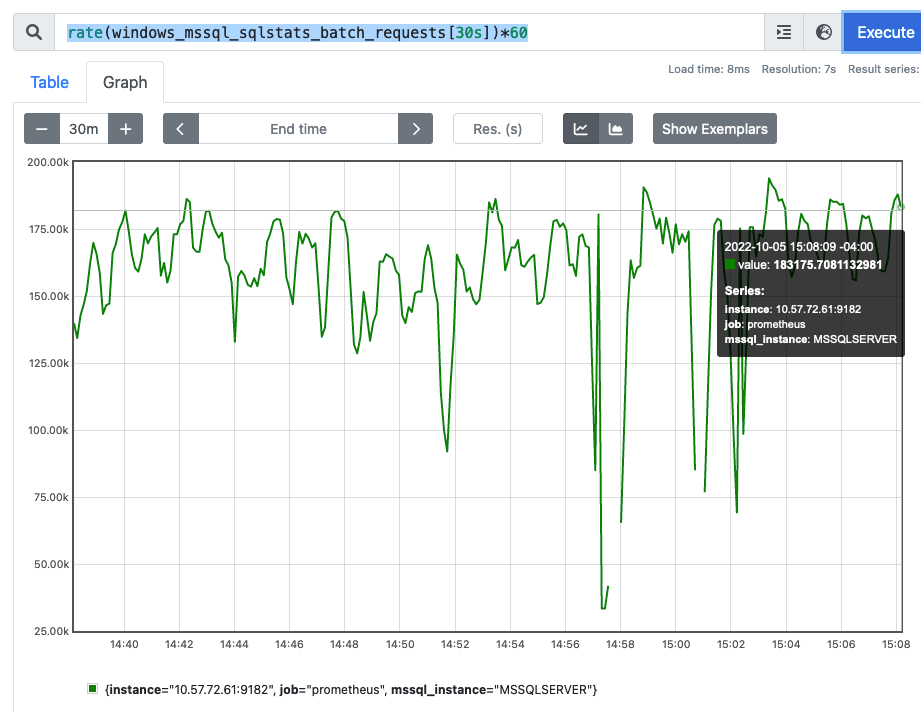
  • Check that we can scrape SQLserver tranactions. In the search/execute box enter something like this
    rate(windows_mssql_sqlstats_batch_requests[30s])*60
  • Put the SQLserver under load with something like HammerDB
  • Hit Execute on the Prometheus server search box and you should see a transaction rate similar to HammerDB
  • Install Grafana and Point it to the Prometheus server (See multiple examples of how to do this)
Continue reading

Generate load on Microsoft SQLserver Windows from HammerDB on Linux

HammerDB on Linux driving load to Windows SQL Server

Often it’s nice to be able to drive Windows applications and databases from Linux, especially if you are more comfortable in a Unix environment. This post will show you how to drive a Microsoft SQL Server database running on a Windows server from a remote Linux machine. In this example I am using Ubuntu 22.04, SQLserver 2019, Windows 11 and HammerDB 4.4

Continue reading

QCOW 3 Ways

How to mount QCOW images as Linux block devices

tl;dr
  • guestmount (requires libguestfs-tools) sudo guestmount -d <vm-name> --ro -i <mountpoint>
  • qemu-nbd (requires the nbd driver)
    • Load the kernel module modprobe nbd max_part=8
    • Bind the device to the image qemu-nbd --connect=/dev/nbd0 <vmdiskimage.qcow>
    • Assuming partition #1 is the target mount /dev/ndb0p1 /a
  • loopback mount. Requires converting qcow to raw
    • Convert qcow to raw qemu-img convert vmdisk.qcow2 -f qcow2 -O raw vmdisk.raw
    • Create a loopback device losetup -f -P vmdisk.raw
    • Locate name of loopback device losetup -l | grep vmdisk.raw
    • Mount (assuming partition #1 on loopback device 99 mount /dev/mapper/loop99p1 /a
Continue reading

Using cloud-init with AHV command line

TL;DR

  • Using cloud-init with AHV is conceptually identical to using KVM/QEMU- we need to use a few different tools with AHV
  • You will need a Linux image that is configured to use cloud-init. A good source is cloud-images.ubuntu.com
  • We will create a cloud-init textual file and create a mountable version using the cloud-localds tool on a Linux host
  • We will attach the cloud-init enabled ubuntu image and our cloud-init customization file to the VM at boot time
  • At boottime ubuntu will access the cloud-init data mounted as a CDROM and do the customization for us
Continue reading

Comparing RDS and Nutanix Cluster performance with HammerDB

tl;dr

In a recent experiment using Amazon RDS instance and a VM running in an on-prem Nutanix cluster, both using Skylake class processors with similar clock speeds and vCPU count. The SQLServer database on Nutanix delivered almost 2X the transaction rate as the same workload running on Amazon RDS.

It turns out that migrating an existing SQLServer VM to RDS using the same vCPU count as on-prem may yield only half the expected performance for CPU heavy database workloads. The root cause is how Amazon thinks about vCPU compared to on-prem.

Benchmark Results

HammerDB results from RDS and Nutanix
Continue reading

Single threaded DB performance on Nutanix HCI

tl;dr

A Nutanix cluster can persist a replicated write across two nodes in around 250 uSec which is critical for single-threaded DB write workloads. The performance compares very well with hosted cloud database instances using the same class of processor (db.r5.4xlarge in the figure below). The metrics below are for SQL insert transactions not the underlying IO.

Single threaded commit heavy insert rates. Latency as seen from SQL insert statement.
Continue reading

AHV Tip: Shutdown multiple VMs in parallel

Often in my lab I want to shutdown a large number of VMs quickly. In the example below I submit the power-off command for a maximum of 50 VMs in parallel. Be aware that we’re using the command line, and in line with true Unix philosophy the OS will assume we know what we are doing and obey us completely and immediately. In other words pasting the below commands to your CVM will immediately shutdown all powered on VMs.

 for i in $(acli  vm.list power_state=on | awk '{ print $(NF) }' |tail -50); do acli vm.off $i &  done

How to deploy Ubuntu cloud images to Nutanix AHV

In this example we use the KVM cloud image from the Canonical Ubuntu image repository. More information on Ubuntu cloud images is on the canonical cloud image page. More detail on the cloud image boot process and cloud-init here: Ubuntu UEC/Imanges.

We can use the Ubuntu cloud image catalog, and specifically use one that has been built to run on KVM. Since AHV is based on KVM/QEMU Nutanix can use that image format directly without any further conversion.

Using a cloud image can be a quicker way to stand up a particular version of Linux without having to go through the Linux installation process (choosing usernames, keyboard types, timezones etc.). However, you will need to pass in a public key so that you can login to the instance once it has booted.

Continue reading

Nutanix Performance for Database Workloads

We’ve come a long way, baby.

Full disclosure. I have worked for Nutanix in the performance engineering group since 2013. My opinions are likely biased, but that also gives me a decent amount of context when it comes to the performance of Nutanix storage over time. We already have a lot of customers running database workloads on Nutanix. But what about those high-performance databases still running on traditional storage?

I dug out a chart that I presented at .Next in 2017 and added to it the performance of a modern platform (AOS 6.0 and an NVME+SSD platform). For this random read microbenchmark performance has more than doubled. If you took a look at a HCI system even a few years back and decided that performance wasn’t where you needed it – there’s a good chance that the HW+SW systems shipping today could meet your needs.

Much more detail below.

Continue reading